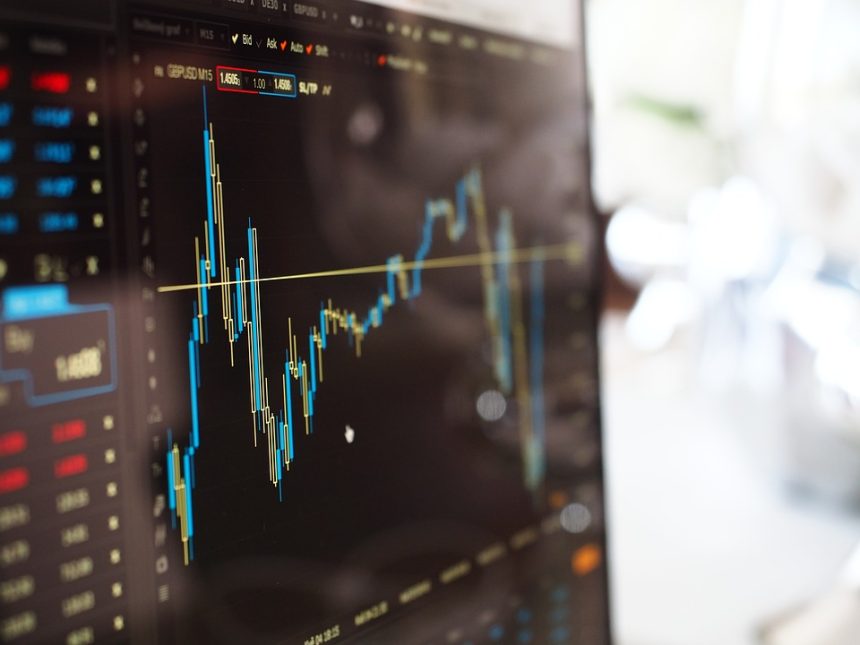
The world of cryptocurrency has gained significant traction over the past decade, attracting investors, technologists, and market enthusiasts drawn by the potential for high returns. As the crypto landscape evolves, understanding market dynamics becomes essential for identifying investment opportunities. One of the most effective methods for discerning these patterns is through technical analysis—an approach that utilizes historical price data, trading volumes, and market psychology to predict future movements. This article will explore key crypto trends and patterns and how you can leverage them to spot opportunities in this volatile market.
Understanding Technical Analysis
Technical analysis is grounded in the belief that prices move in trends and that historical performance can provide insights into future price movements. It differs from fundamental analysis, which looks at factors such as a cryptocurrency’s underlying technology, its use case, and market sentiment. While both approaches can be valuable, technical analysis offers traders a way to read the market in real-time, making it particularly suited for the fast-paced crypto environment.
Key Trends in Cryptocurrency Markets
-
Bull and Bear Markets
- Bull Market: Characterized by rising prices, increased trading volumes, and widespread optimism, a bull market presents opportunities for buyers (long positions). The key is to recognize entry points where momentum builds, such as during breakout patterns.
- Bear Market: Conversely, a bear market indicates declining prices and pessimism among traders. Identifying short-selling opportunities or even dollar-cost averaging into quality tokens can be advantageous during these times.
-
Market Cycles
- The crypto market often operates in cycles, influenced by factors such as Bitcoin’s halving events, regulatory news, and macroeconomic conditions. Recognizing these cycles—characterized by accumulation, markup, distribution, and markdown phases—can help traders time their entries and exits strategically.
- Volume Trends
- Trading volume provides insight into the strength of a price movement. A price increase accompanied by high volume suggests strong buying interest, while rising prices with diminishing volume may indicate a potential reversal. Monitoring volume trends can enhance decision-making around potential breakouts or consolidations.
Patterns to Watch For
Technical analysis involves identifying specific patterns within price charts. Below are some key patterns that traders frequently analyze:
-
Head and Shoulders
- This reversal pattern can signal a trend change. An inverse head and shoulders pattern, occurring during a downtrend, suggests a bullish reversal, while a traditional head and shoulders pattern in an uptrend indicates a bearish reversal.
-
Triangles
- Formed by converging price levels, triangles (ascending, descending, and symmetrical) can signal continuation or reversal. Traders watch for breakouts from these formations to determine potential directional moves.
-
Double Tops and Bottoms
- A double top is a bearish reversal pattern formed after an uptrend, while a double bottom indicates a bullish reversal after a downtrend. These patterns signify exhaustion of momentum and create potential entry points for traders.
-
Support and Resistance Levels
- Support levels indicate where demand has historically been strong enough to prevent price from falling further, while resistance levels signify areas where selling pressure is typically encountered. Identifying and trading around these levels can enhance profitability, as breakouts or reversals often occur at these critical points.
- Moving Averages
- Simple Moving Averages (SMA) and Exponential Moving Averages (EMA) are commonly used to identify trends. Crossovers between different moving averages (like the 50-day and 200-day) can signal buy or sell opportunities, widely referred to as "golden crosses" and "death crosses."
Utilizing Technical Indicators
Traders often combine patterns with technical indicators to confirm their analysis. Key indicators include:
- Relative Strength Index (RSI): Measures the speed and change of price movements, helping identify overbought or oversold conditions.
- Moving Average Convergence Divergence (MACD): A momentum indicator that demonstrates the relationship between two moving averages, helping traders spot trend direction and reversals.
- Bollinger Bands: These bands expand and contract based on market volatility, allowing traders to assess when a market may be overbought or oversold.
Tips for Successful Technical Analysis
- Practice Risk Management: Always know your risk tolerance and set stop-loss orders. The crypto market can be unpredictable, and protection against significant losses is crucial.
- Stay Informed: Keep up with market news and social sentiment. Events such as regulatory updates, technological advancements, or macroeconomic shifts can impact price movements significantly.
- Backtest Your Strategies: Before committing capital, test your strategies using historical data to understand their potential effectiveness.
- Use Multiple Time Frames: Analyzing charts across different time frames can provide a comprehensive view, helping you capture both short-term trades and long-term trends.
Conclusion
Technical analysis can be a potent tool for navigating the complex world of cryptocurrency trading. By identifying trends and patterns, utilizing key indicators, and practicing sound risk management, traders can enhance their ability to spot lucrative opportunities. While the volatile nature of cryptocurrencies presents challenges, leveraging technical analysis can empower you to make informed decisions, helping you thrive in this dynamic market. Remember, continuous learning and adaptability are vital, ensuring that you remain attuned to this ever-evolving financial landscape.


